
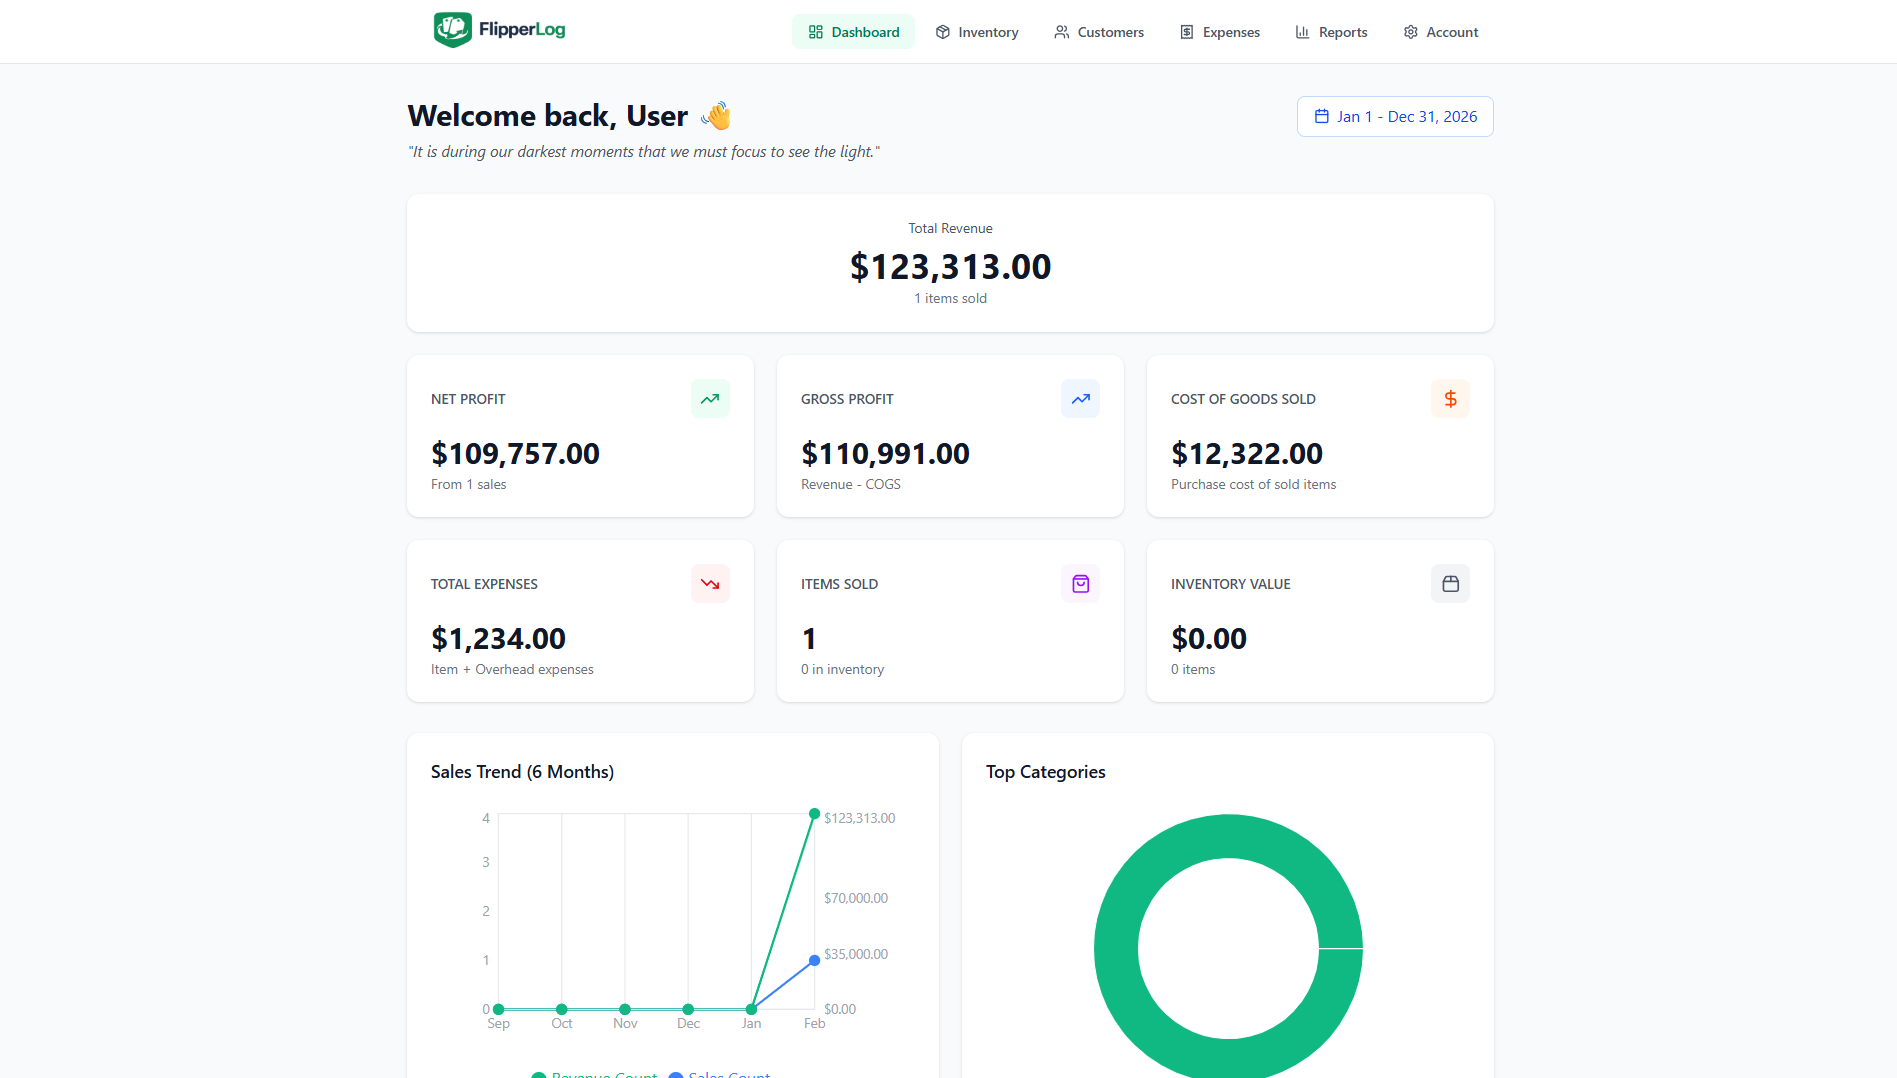
Your numbers at a glance
The dashboard shows revenue, net profit, cost of goods sold, total expenses, items sold, and inventory value for the current year. All metrics run from January 1 to December 31; inventory carries over into the new year so you never lose track of stock.
- Net profit, gross profit, and COGS calculated automatically from sold items
- Sales trend chart for the last six months
- Category breakdown and inventory turnover metrics
- Year selector: Jan 1 – Dec 31 with one click
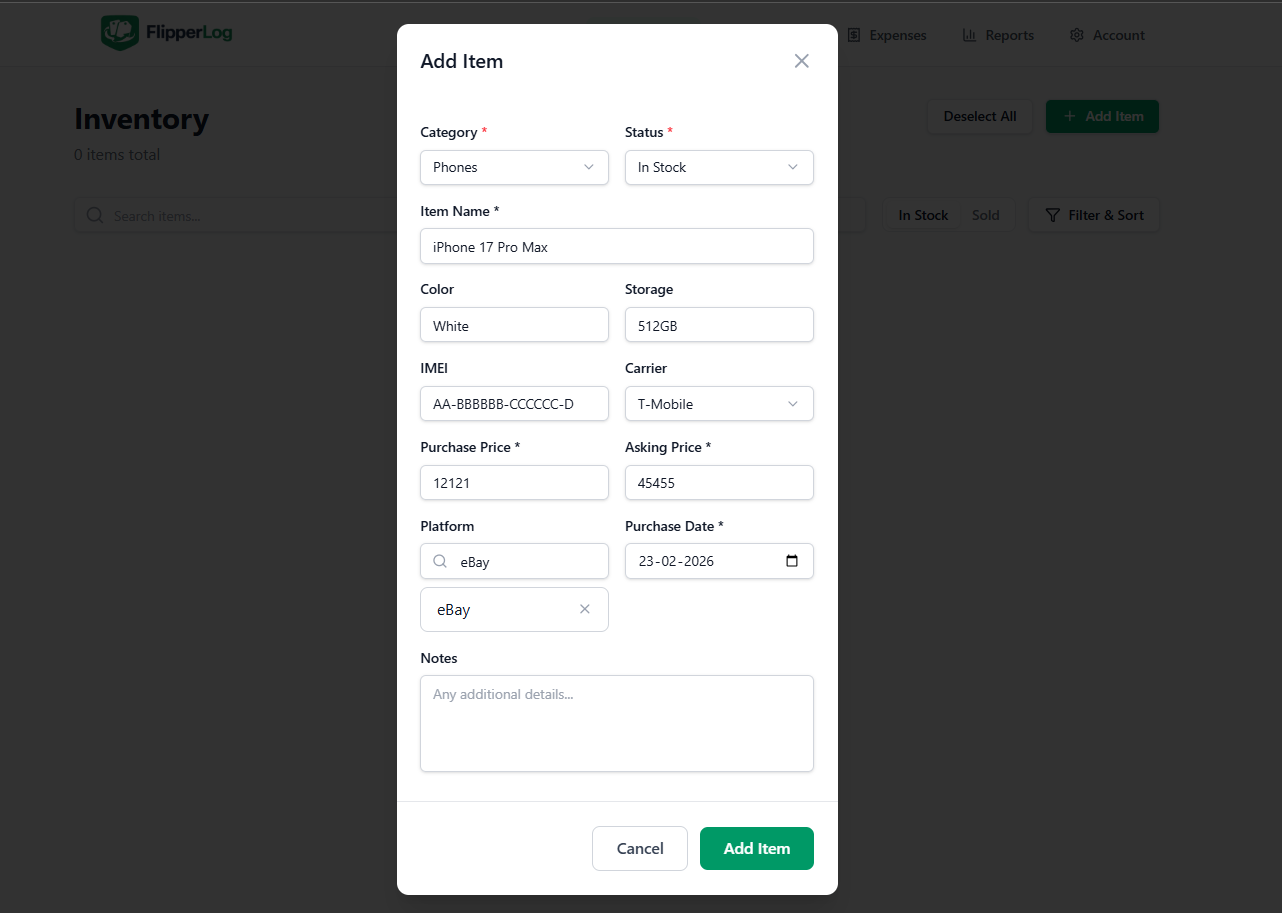
Fields that match what you sell
When you add an item, you choose a category. The form adapts so you only see relevant fields: cars get year, make, model, trim, VIN, and color; phones get IMEI, storage, color, and carrier; shoes and clothes get size. Every item has name, purchase price, platform, and notes.
- Cars: Year, Make, Model, Trim, VIN, Color
- Phones: IMEI, Storage, Color, Carrier
- Shoes & clothes: Size
- Categories: Phones, Shoes, Clothes, Electronics, Cars, Collectibles, Other
Cars
Vehicle-specific fields from the Add Item form
Add Item · Cars
Shoes
Size and item details
Add Item · Shoes
Phones
IMEI, storage, color, carrier
Add Item · Phones
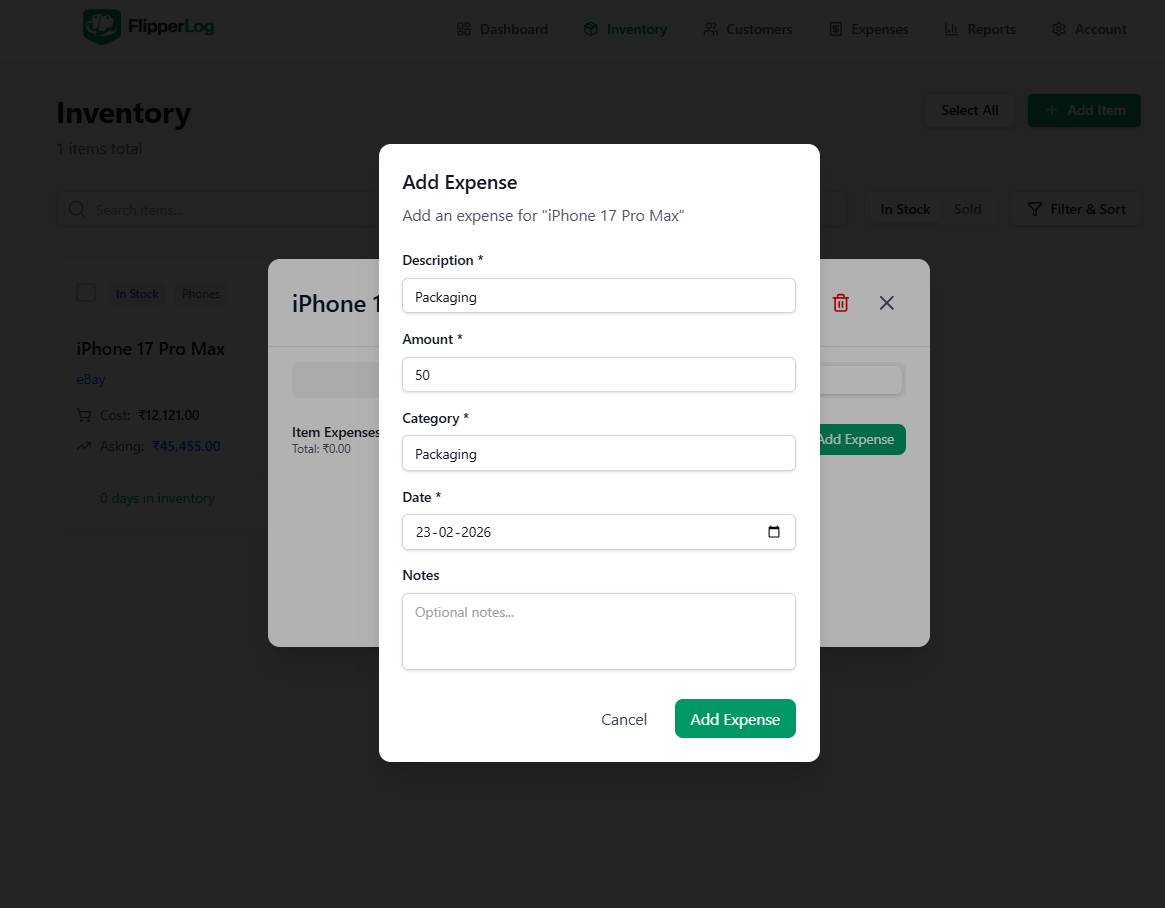
Attach costs to each item
Link expenses directly to an item (shipping, repairs, platform fees, parts) or track overhead separately (storage, tools, subscriptions). Item expenses reduce that item’s profit; overhead is included in your overall net profit. The dashboard formula is: Net profit = Revenue − COGS − item expenses − overhead.
- Item expenses: shipping, repairs, fees — tied to one inventory item
- Overhead: storage, software, mileage — not tied to a single item
- True profit per item when you mark it sold
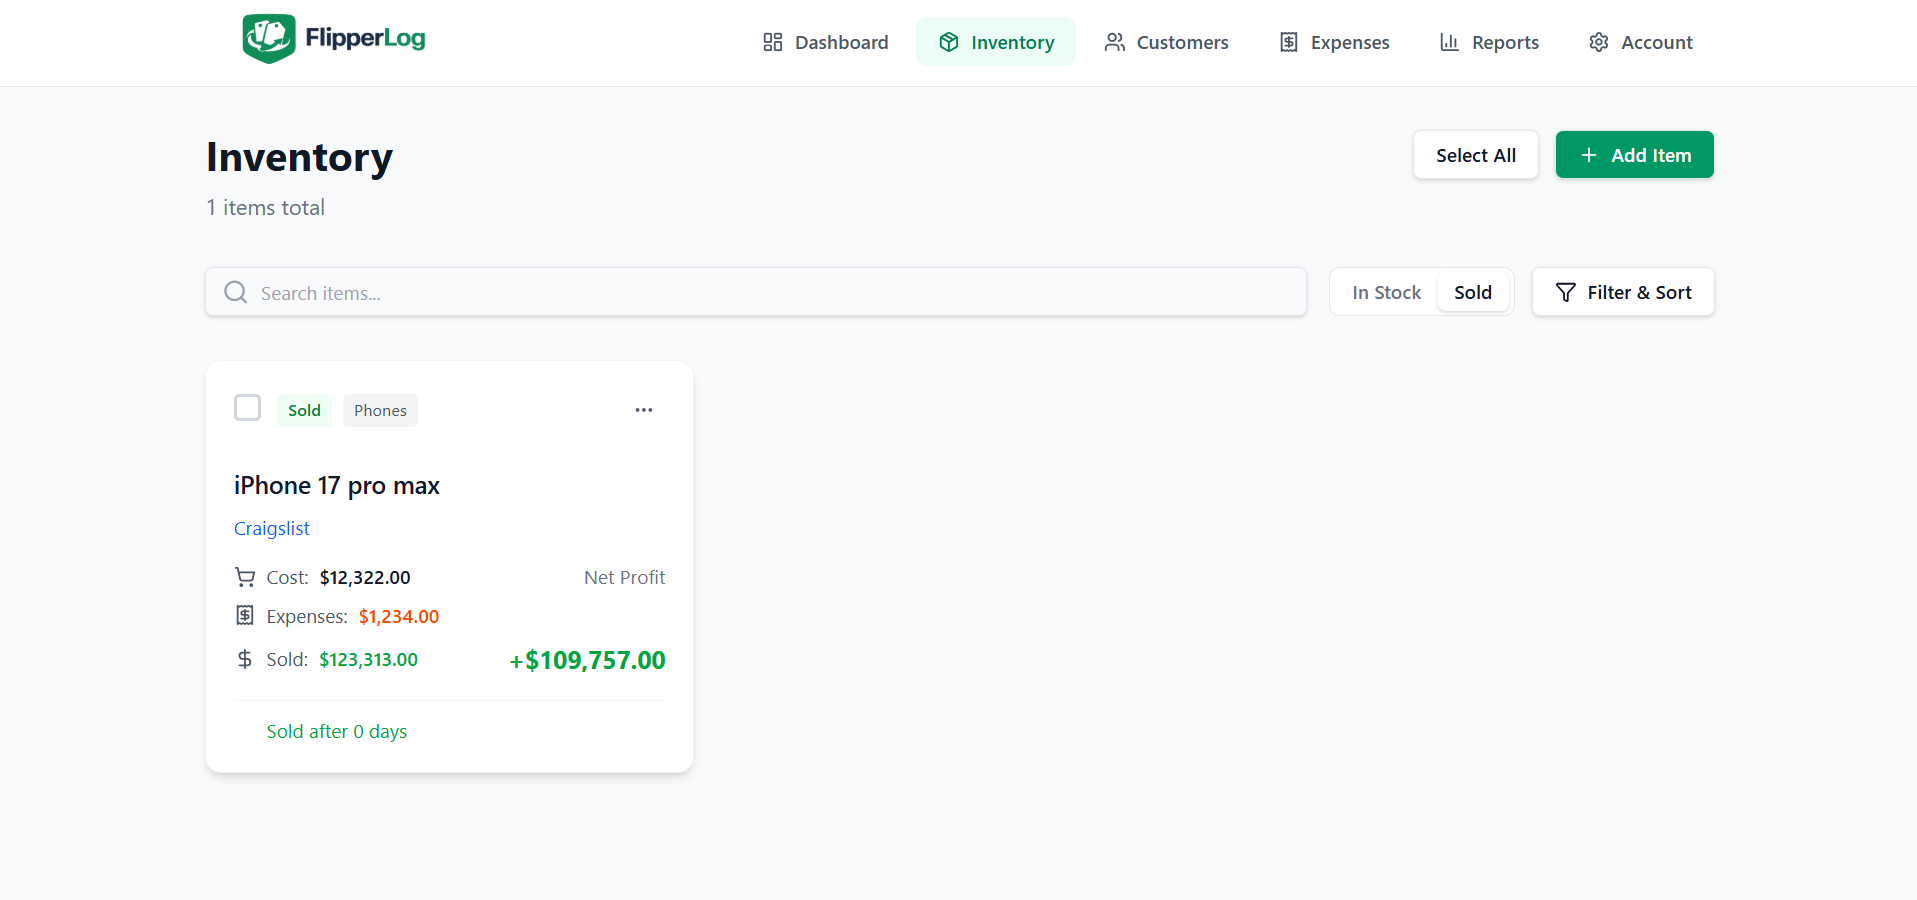
See how long items sit
Days in inventory are calculated from purchase date to sale date. The dashboard shows average days to sell and turnover rate so you can spot slow movers and adjust what you buy. Inventory list and item details both show how many days an item has been in stock or how long it took to sell.
- Automatic from purchase date to sale date
- Dashboard: average days to sell and turnover rate
- Sort and filter inventory by how long items have been in stock
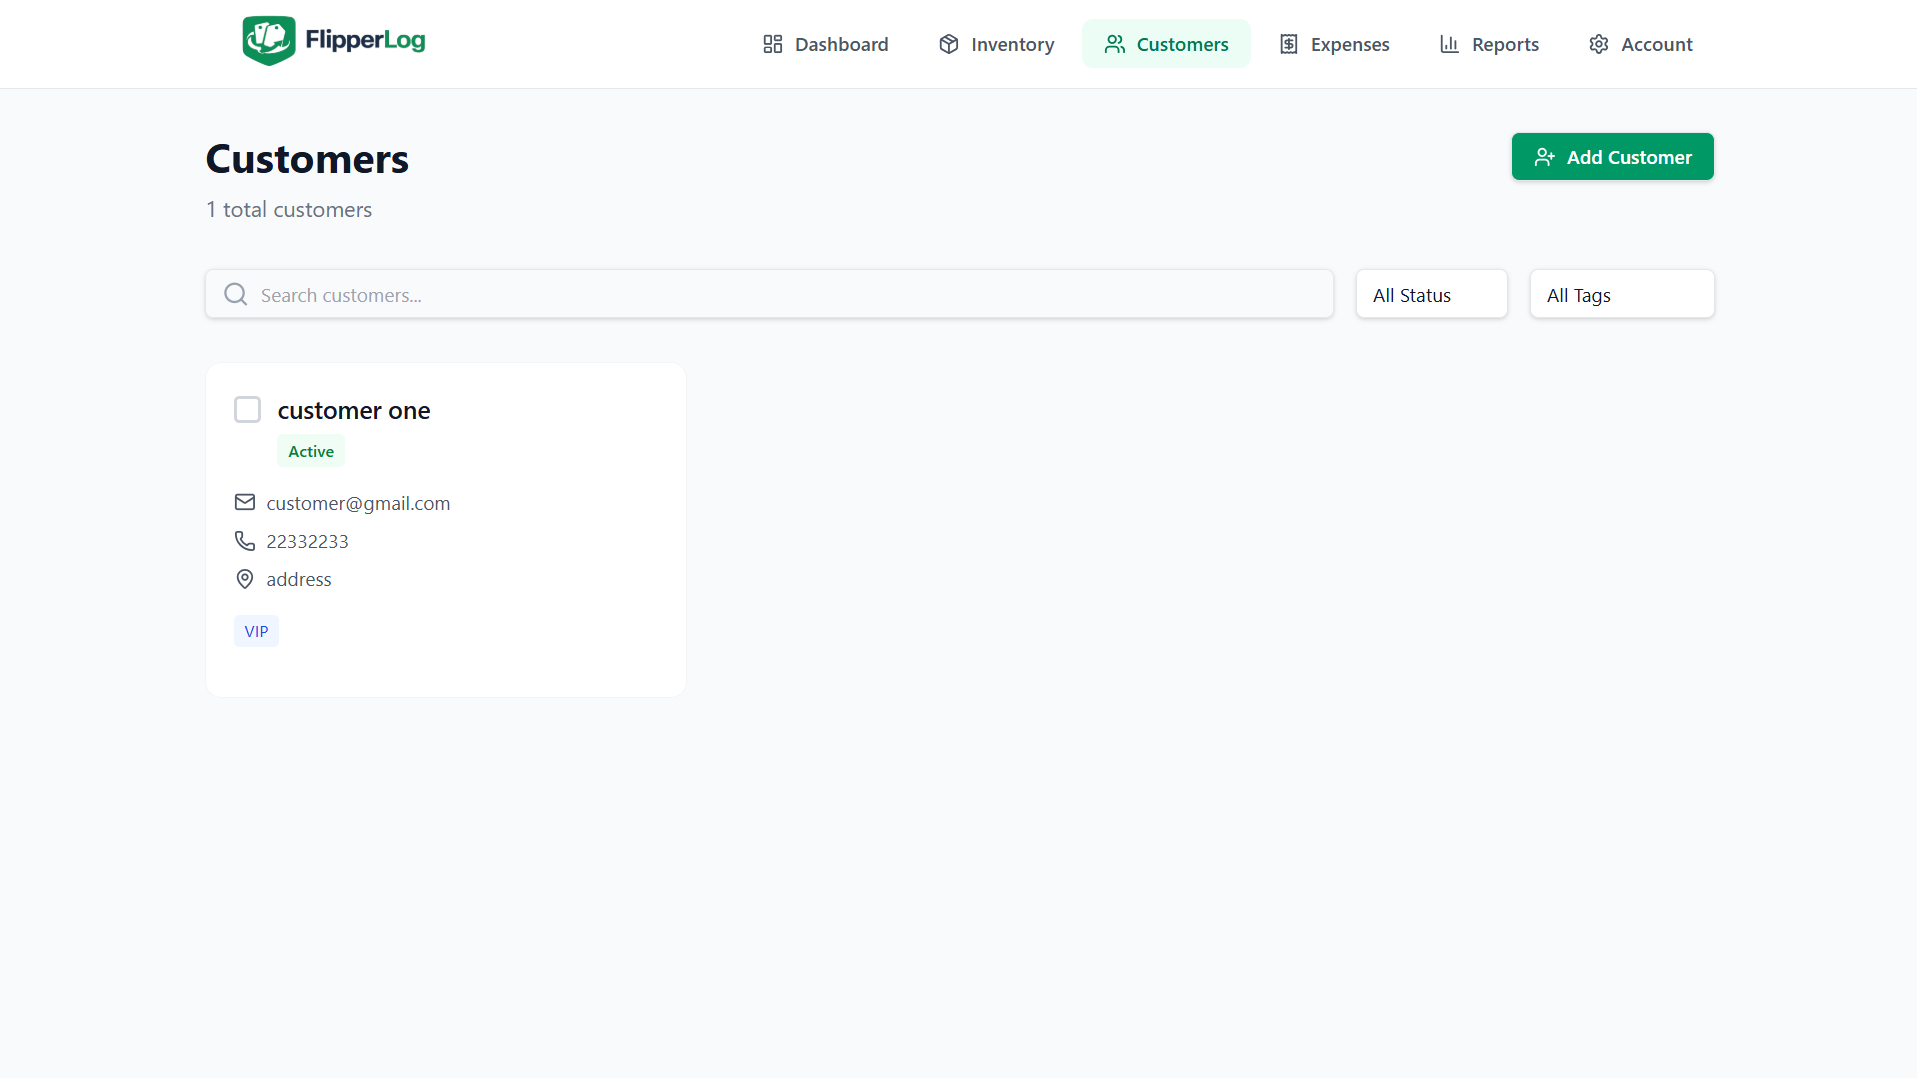
Know your buyers
Add customers and link them to sold items. See total purchases and total spent per customer, plus full purchase history. Store name, email, phone, and notes so you can follow up and identify repeat or high-value buyers.
- Purchase history per customer
- Total spent and number of items bought
- Contact details and notes in one place
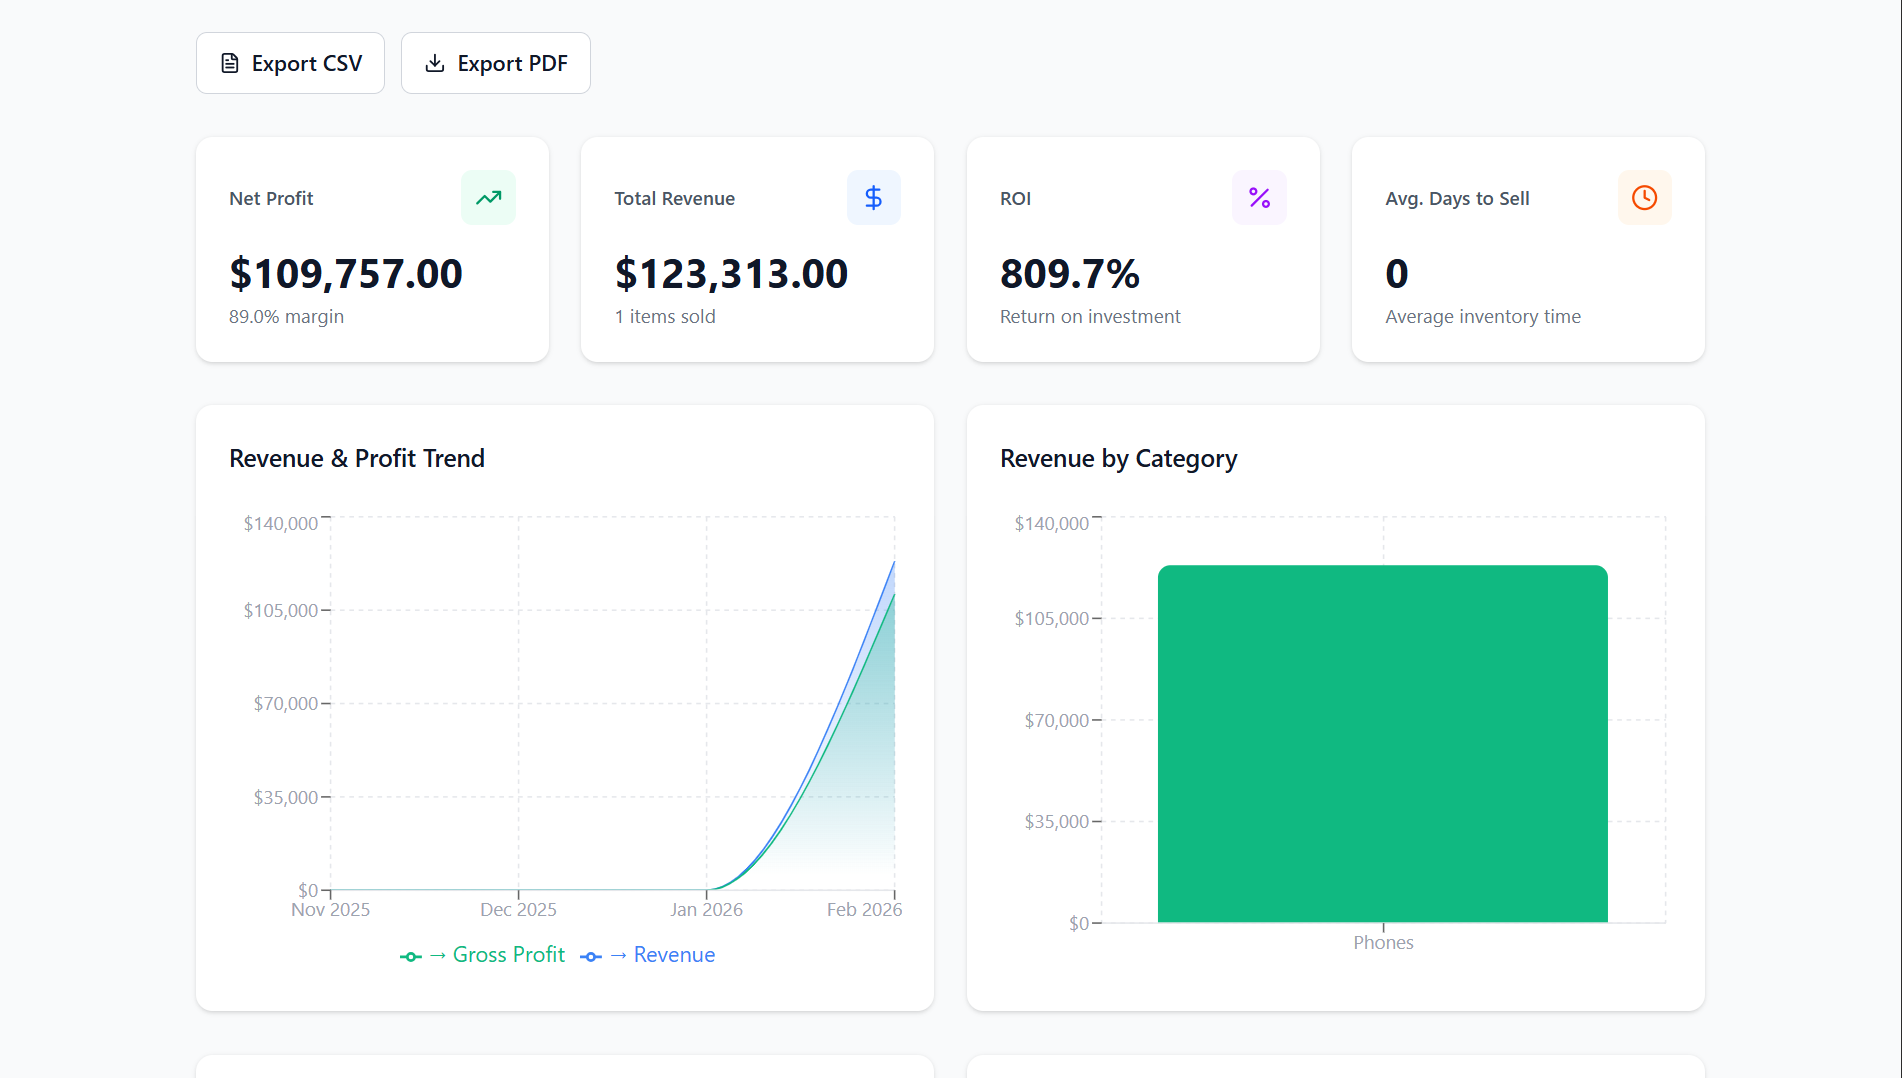
Charts and exports for taxes and planning
Reports show profit trends over time, category breakdown, and platform performance. Choose date ranges (e.g. last month, last 3 or 6 months). Export to CSV for spreadsheets or PDF for records and accountants. All data respects your default currency.
- Profit trends, category pie chart, platform comparison
- CSV and PDF export with date filters
- Tax-ready summaries and detailed line items
40+ currencies, one place
Set your default currency once (USD, EUR, CAD, GBP, AUD, and 34 more). All amounts — dashboard, inventory, expenses, reports — use that currency.
- Single default currency for the whole app
- Consistent formatting in dashboard, inventory, and exports